Patent And Litigation Trends for 3D Printing Technologies
The success story of 3D printing began in 1984 when Charles W Hull applied for a patent for stereolithography. In 1989 S Scott Crump of Stratasys invented fused deposition modelling, which fuses material layer by layer until a 3D object is created. This style of additive manufacturing is what most people associate with 3D printing. In 2009 the patent for fused deposition modelling expired and companies started to take a different approach by trying to sell to consumers instead of business to business. Together with the rise of Kickstarter, a perfect storm formed and hype around 3D printing in the early 2010s was born.
In order to identify 3D print-related patents, the IPlytics platform database performed an extensive keyword search of worldwide filed patents in the 3D-print technology field. The search was based on the patent’s content, making use of state-of-the-art stemming and semantic indexing methods. Between 2007 and 2019 the analysis identifies 95,302 patents and 43,718 patent families (unique patents in the INPADOC database) relevant for 3D printing. Figure 1 illustrates the number of patent applications between 2007 and 2018.
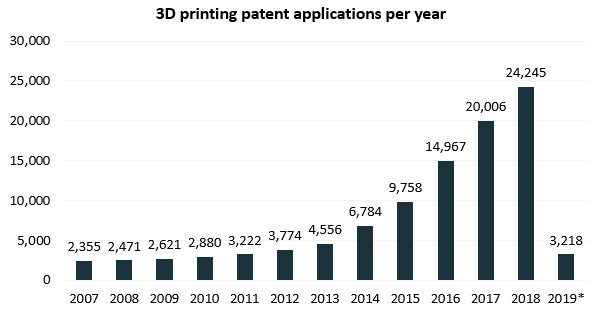 *January to February 2019
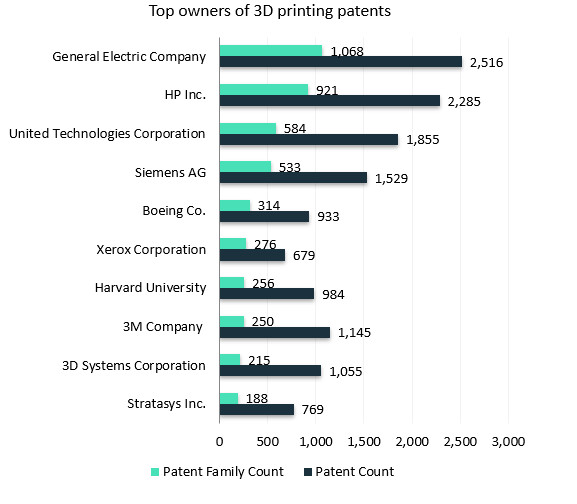
In order to identify patent ownership, IPlytics aggregates patents with regard to the patent portfolio of each company, making use of entity disambiguation techniques. Further, patent applications are counted with regard to the corresponding patent family in order to record the number of unique patented inventions per company. Figure 2 shows that General Electric, HP Inc and United Technologies Corporation are the three strongest 3D printing-related patent owners. Out of the top 10 3D printing patent holders, we identified several US companies and one German company.
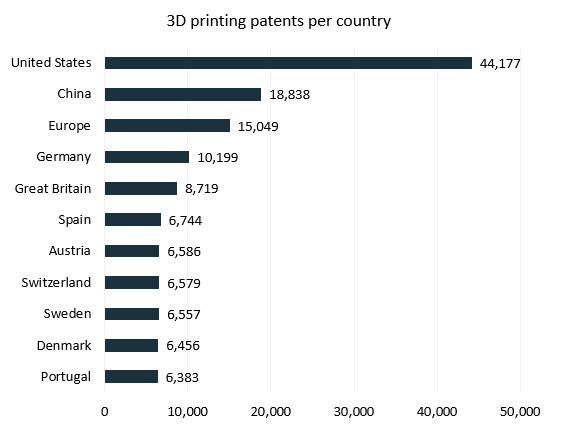
 In order to identify at which patent office the patents were filed, the IPlytics platform counted 3D printing-related patents according to the office’s country. As illustrated in Figure 3, most patents were filed in the United States, followed by China and Europe.
IPlytics used statistical patent valuation indicators to analyse the strengths, weaknesses and positioning of patent portfolios. In close cooperation with the Technical University of Berlin, Mines Paris Tech and Northwestern Chicago, IPlytics used scientifically validated methods to calculate relevant indicators. It integrated seven indicators in total – Table 1 shows two of them.
The market coverage indicator estimates the patent family size by counting each patent family’s country divided by the country’s gross domestic product. The count is normalised and compared to industry averages (using international patent classification (IPC) or cooperative patent classification (CPC), publication year and country). A high market coverage value reflects a global internationalisation strategy and wide legal market protection. Further, a high market coverage value reflects a high-perceived patent value for the applicant. Patent application and patent maintenance fees create considerable costs at each patent office. The more countries in which a patent has been filed for, the higher the perceived international market potential for the invention.
Table 1 shows that all 3D-printing patent portfolios from the top 10 patent owners have extensive international coverage (a score higher than one is above average).
The technical relevance indicator counts the number of prior art citations that a patent receives (forward citations). Citations are counted as citing families. Self-citations as well as subsidiary citations are not counted. Finally, counts are normalised by year, country of jurisdiction and main IPC/CPC. A high technical relevance value reflects the patent’s technical relevance, since subsequent patents must cite the patent as prior art. Patent citations are reviewed and verified by objective and qualified patent examiners. A high technical relevance value thus identifies leading technologies in a particular market segment.
Table 1 shows that the 3D printing patent portfolios of the top 10 patent owners have high technical relevance (a score higher than one is above average). General Electric, Stratasys and Harvard have the highest technical relevance score, while HP and Xerox have the lowest.
Table 1: Market overview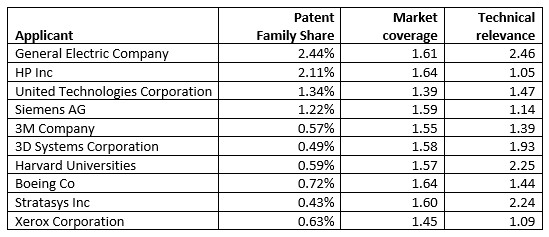
The IPlytics platform database was further used to identify 3D printing patents subject to litigation in US district courts and 3D printing patents subject to a patent trade (reassignment) within the data set of 3D printing-related patents.
Between 2000 and 2018 there have been 155 litigation cases in the United States in the 3D printing field. Figure 4 shows the number of cases from 2007 to 2018.
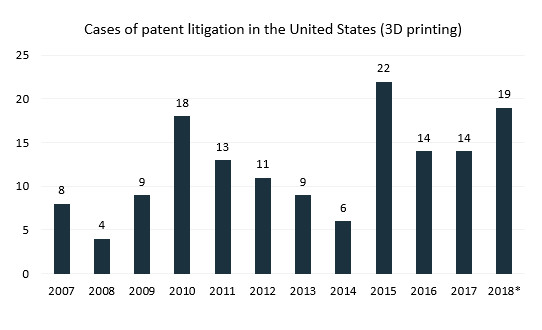 *2018 without November and December
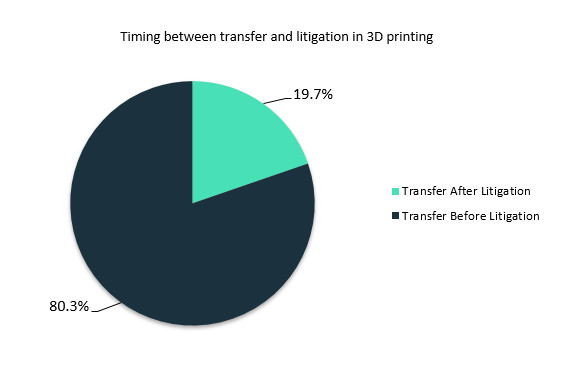
From the 155 litigated patents in 3D printing a total of 71 (45%) have been transferred (reassigned) at some point. By comparing the date of the first transfer with the date of the first litigation the IPlytics platform was used to assess the transfer timing before or after the litigation took place. It turned out that 80% of all patents that have been both litigated and transferred have changed owners before the litigation, with 22.5% doing so within the same year.
Action plan
Patenting is increasing sharply for 3D printing technologies. Further, 3D printing patents are increasingly transferred and litigated. Senior patent managers and patent directors involved in industries where 3D printing has an impact should consider the following:
future technologies involving 3D printing will rely increasingly on patented technology;
the number of 3D printing patents is constantly rising – patent directors should start to consider royalty costs and appropriate security payments;
patent directors should not only consider information retrieved from patent data, but also monitor data on patent litigation or data on patent transfers; and
senior patent managers must monitor the dynamic 3D printing patent market, where patent assertion entities may acquire patent portfolios to assert extensive royalty payments.
Source: iam

Recent Comments